

Every Tuesday morning, plant managers across mid-market manufacturing portfolio companies look at the same frustrating pattern: another week of missed OTIF targets, an unexplained dip in margins, and shift reports that claim 92 percent efficiency while the shipping dock tells a different story. If you suspect your plant is bleeding capacity between shifts but can't prove it without drowning in manual spreadsheet audits, you need a structured shift variance audit checklist. Traditional end-of-week reconciliations hide micro-stoppages, unallocated labor, and scheduling gaps behind averaged numbers. This guide provides a step-by-step framework to automate workforce analytics, isolate lost plant capacity, and secure your shift margins before the next operating review.
The Real Cost of Shift Variance: Why Traditional Audits Fail
Plant floors run on momentum, but accountability often runs on paper. Manual clipboards, delayed ERP-MES reconciliations, and laggy end-of-week reporting create a blind spot that directly impacts plant margins.
When a supervisor records downtime reasons manually at the end of an eight-hour shift, accuracy drops significantly. Operators default to broad categories like "maintenance" or "material wait" rather than logging the five-minute micro-stoppages that actually drain capacity.
This delayed reporting hides the delayed execution truth of the shop floor. By the time finance reviews the variance against the standard routing, the production window has closed, the crew has rotated, and the opportunity to recover the margin is gone.
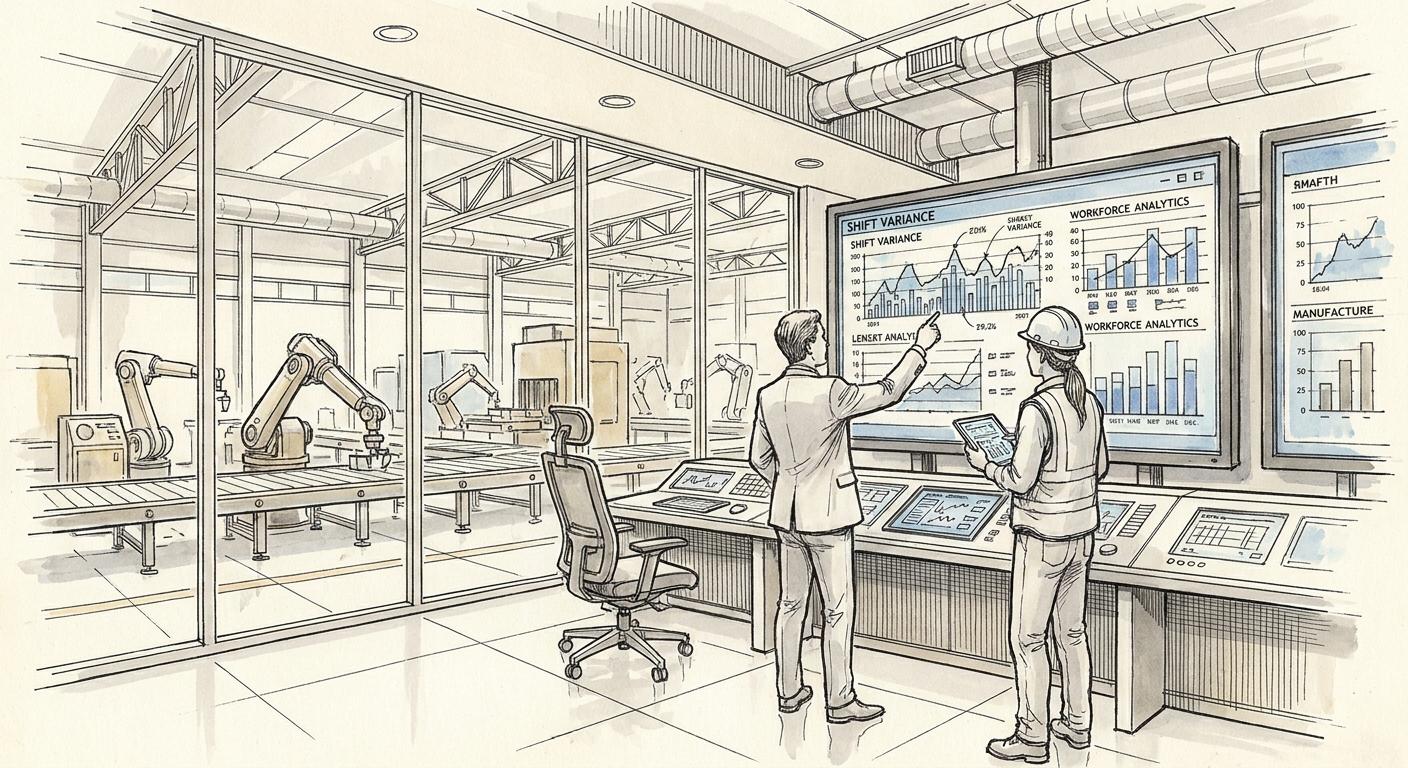
Shift variance is the measurable deviation between scheduled labor costs/capacity and actual plant output during a specific production window. Automated workforce analytics use integrated data streams to instantly quantify these discrepancies without manual spreadsheet reconciliation.
Phase 1: Baseline Data Integrity (ERP vs. MES vs. Reality)
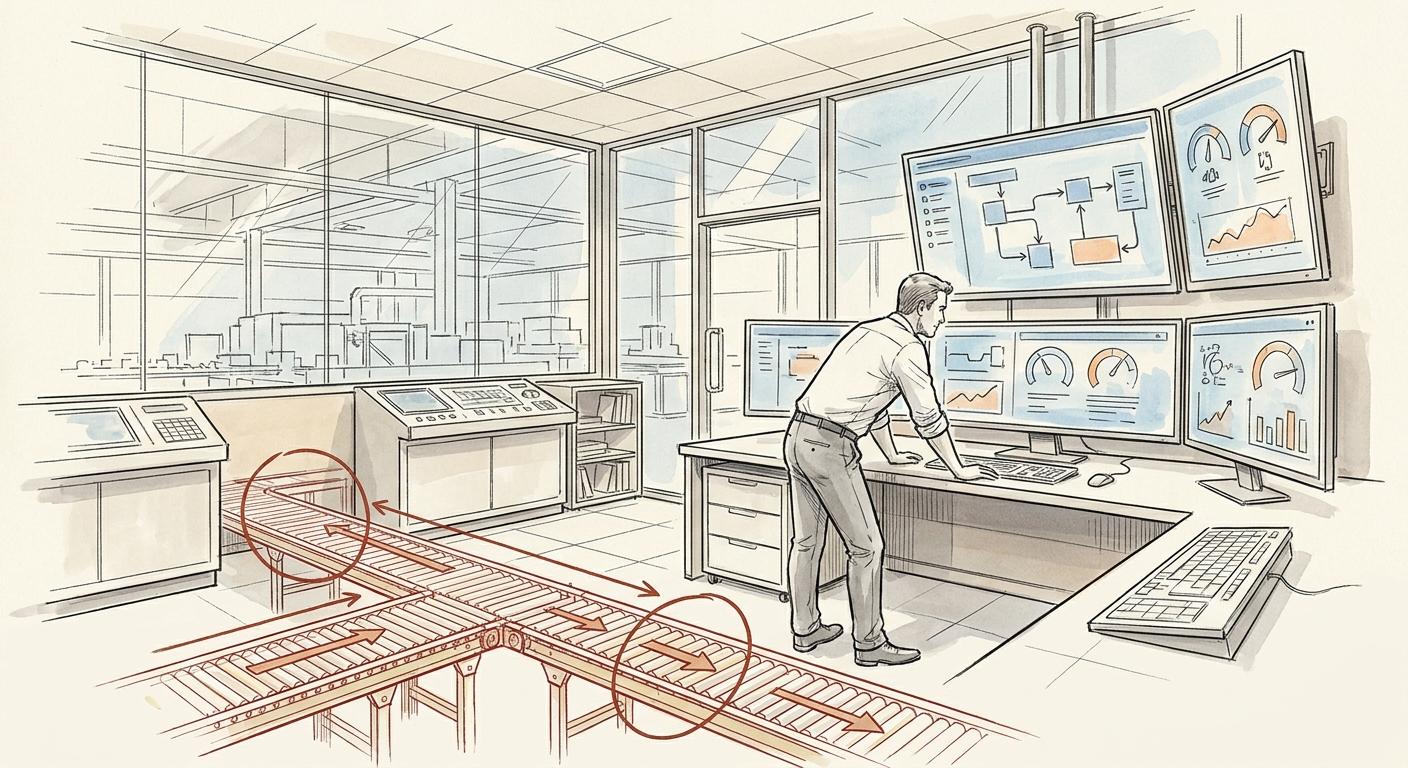
Before you can fix capacity losses, you must verify whether your foundational data systems agree on what actually happened on the floor. Most plants suffer from an ERP-MES data gap where financial costing assumptions bear little resemblance to shop floor reality.
Use this checklist to audit your baseline data integrity:
- Routing Time Audit: Compare standard labor hours entered in the ERP against actual cycle times recorded by machine sensors for identical part numbers.
- Time-Coding Verification: Cross-reference physical punch-in data with direct labor job-code allocations to catch misassigned indirect hours.
- Scrap and Rework Reconciliation: Verify that scrapped units identified at quality checkpoints are immediately matched with raw material consumption logs.
- Shift Handover Gap Analysis: Check if the 15-minute window between shift changes is accounted for as productive time, downtime, or unassigned labor.
Closing these foundational gaps removes the noise from your reporting. You cannot solve margin erosion if your systems cannot agree on whether an operator spent two hours on a setup or waiting for an overhead crane.
Phase 2: Quantifying Lost Plant Capacity
Capacity isn't just about whether a machine is powered on; it is about whether it is producing salable parts at the rated speed. Isolated changeover drag and operator availability bottlenecks consistently erode theoretical capacity.
Follow these checklist steps to quantify where your plant is losing output:
- Isolate Changeover Drag: Measure the exact duration from the last good part of Batch A to the first good part of Batch B, separating setup time from adjustment time.
- Track Micro-Downtime Clusters: Flag any machine stop lasting between two and five minutes that does not trigger a formal maintenance work order but accumulates into hours of lost time per shift.
- Measure Operator Availability: Audit the ratio of direct labor present at the station versus active machine engagement time during peak production hours.
- Evaluate Speed Losses: Compare actual parts per hour against nameplate capacity to catch subtle run-rate degradations caused by worn tooling or suboptimal material feeds.
Quantifying these losses transforms vague operational complaints into hard numbers. When you can prove to a CFO that shift changeovers are consistently taking 45 minutes instead of the scheduled 20, you have a direct target for operational improvement.
Phase 3: Auditing Unallocated and Indirect Labor
Indirect labor is often the largest unmanaged variable in plant P&Ls. When operators spend unrecorded time waiting for material, hunting for fixtures, or performing undocumented rework, job costing becomes a guessing game.
Implement this checklist to track the grey areas that drain shift profitability:
- Material Wait Time Tracking: Measure the frequency and duration of line stoppages caused by late forklift delivery or staging errors.
- Rework Labor Capture: Ensure every hour spent repairing defective units is logged against a specific non-conformance code rather than blended into direct production hours.
- Indirect Task Allocation: Audit how much time direct-hire operators spend on cleaning, meetings, and training versus active value creation.
- Estimate-vs-Actual Variance by Crew: Compare shift-to-shift labor efficiency to identify training gaps or workflow bottlenecks specific to particular teams.
Uncovering unallocated labor requires connecting human activity to machine telemetry. Without automated workforce analytics, these hours simply disappear into overhead, skewing job costing and eroding product margins.
Phase 4: Automating the Shift Variance Loop with AI
Relying on spreadsheets to audit shift variance is a lagging strategy. By the time an analyst compiles the pivot tables, the root cause of Tuesday's bottleneck is buried under three days of new production.
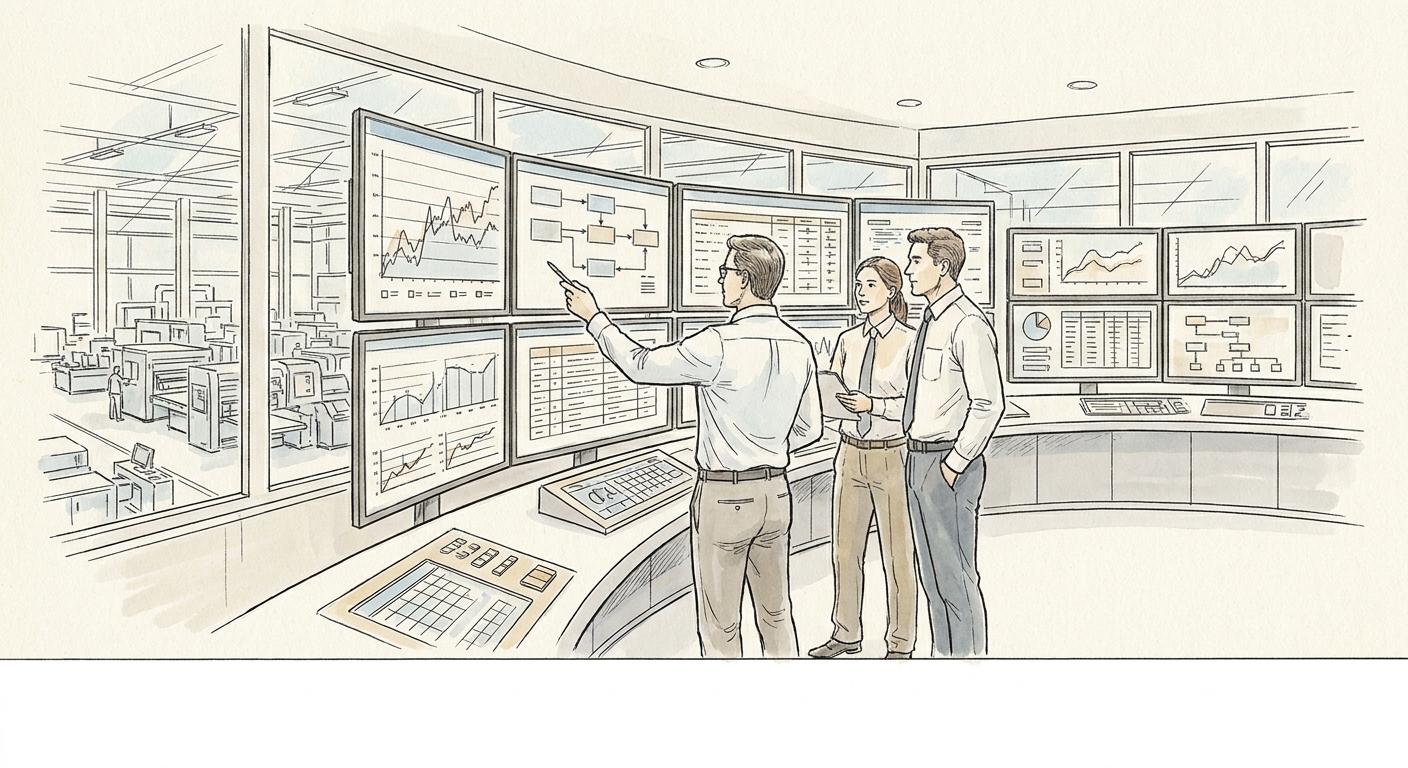
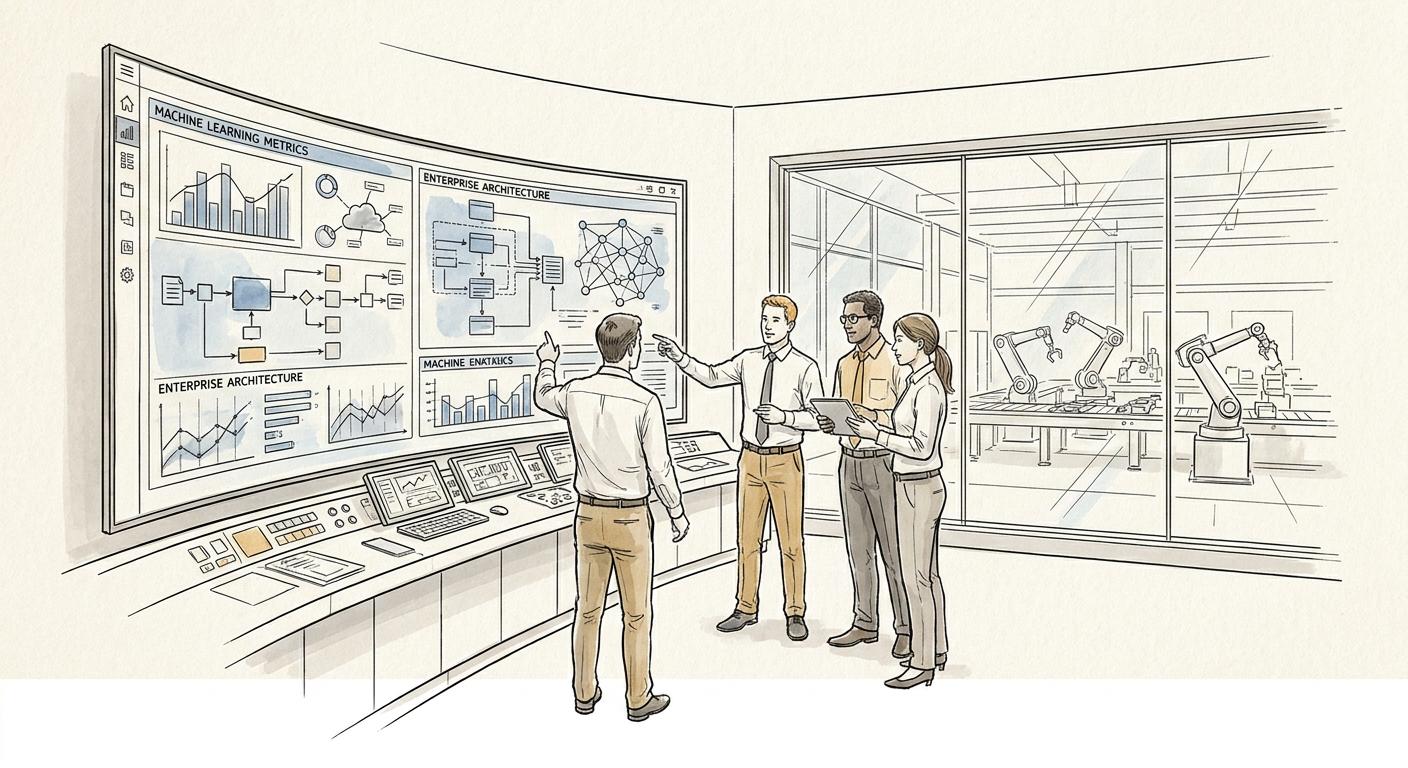
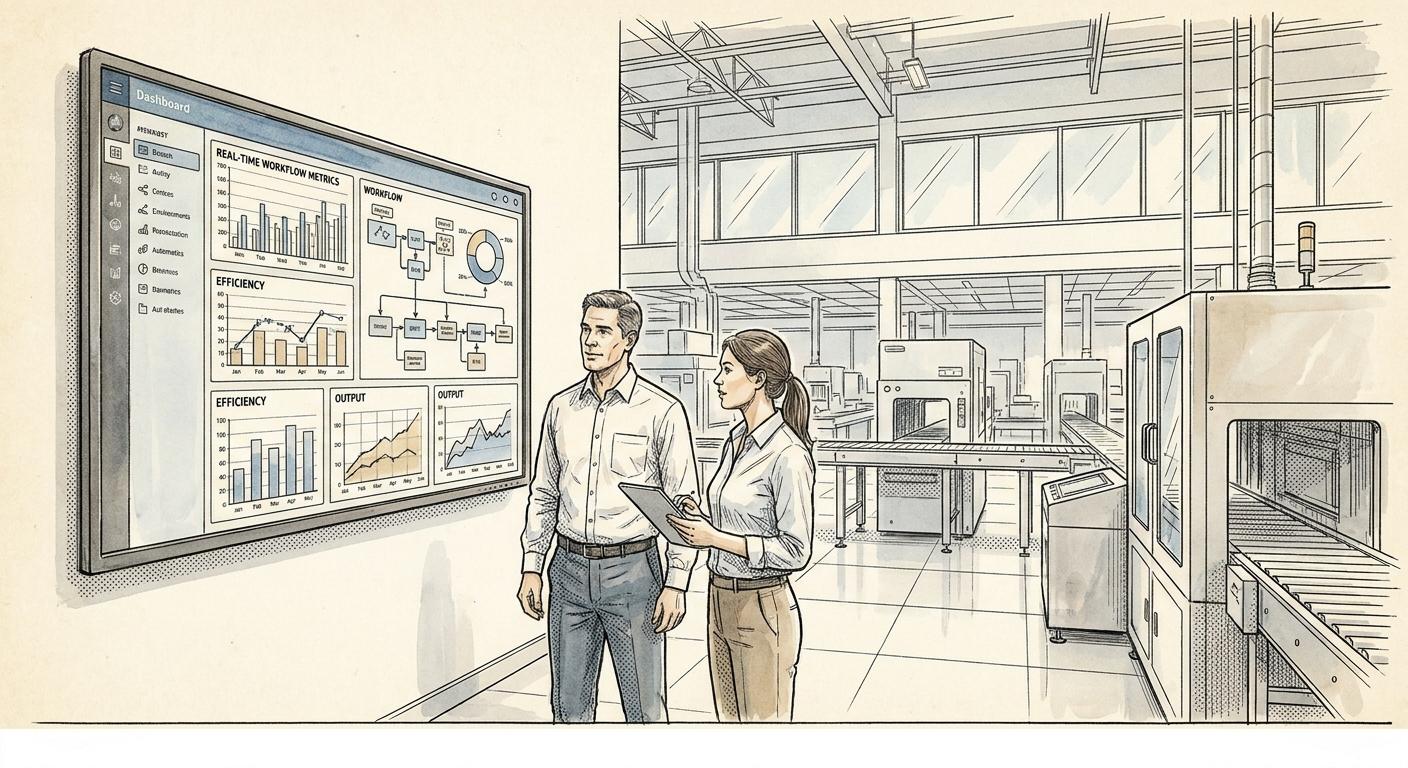
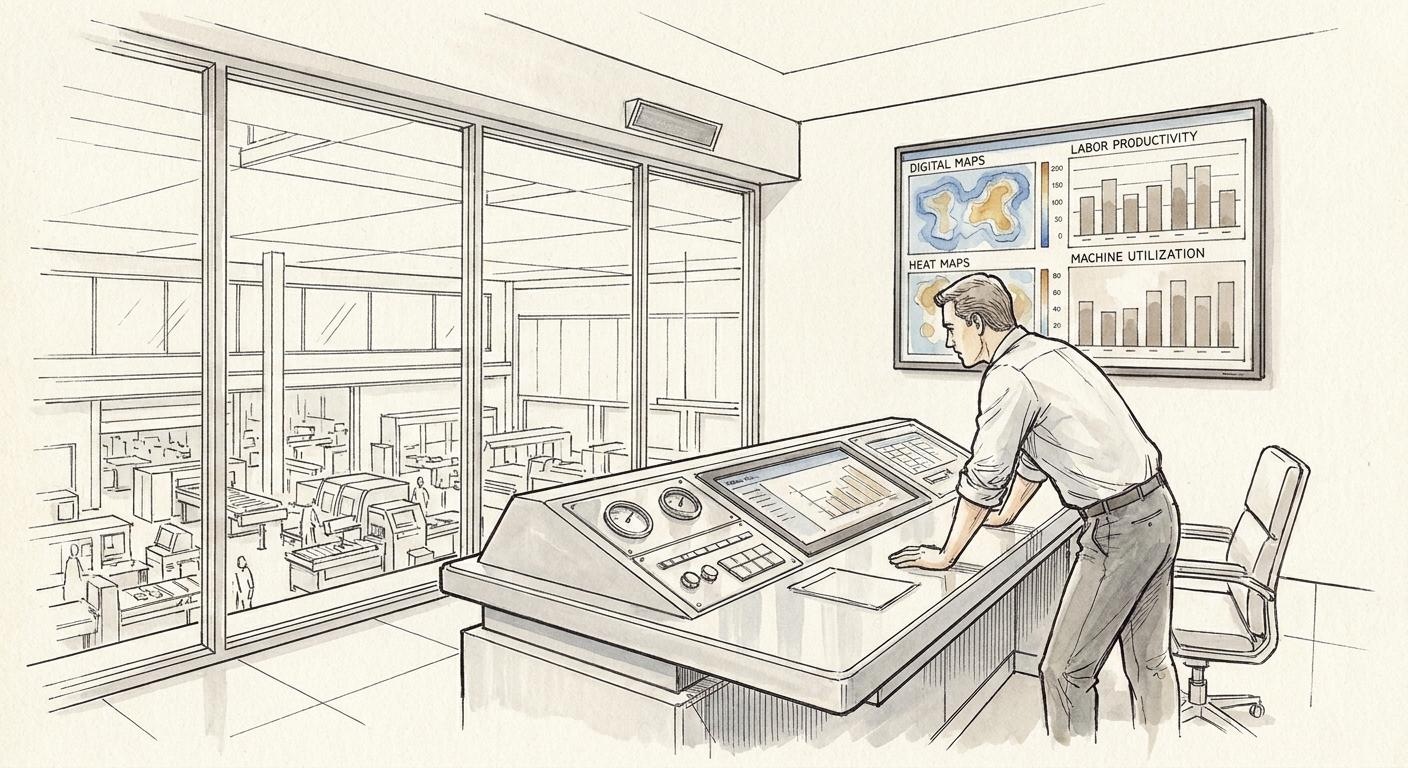
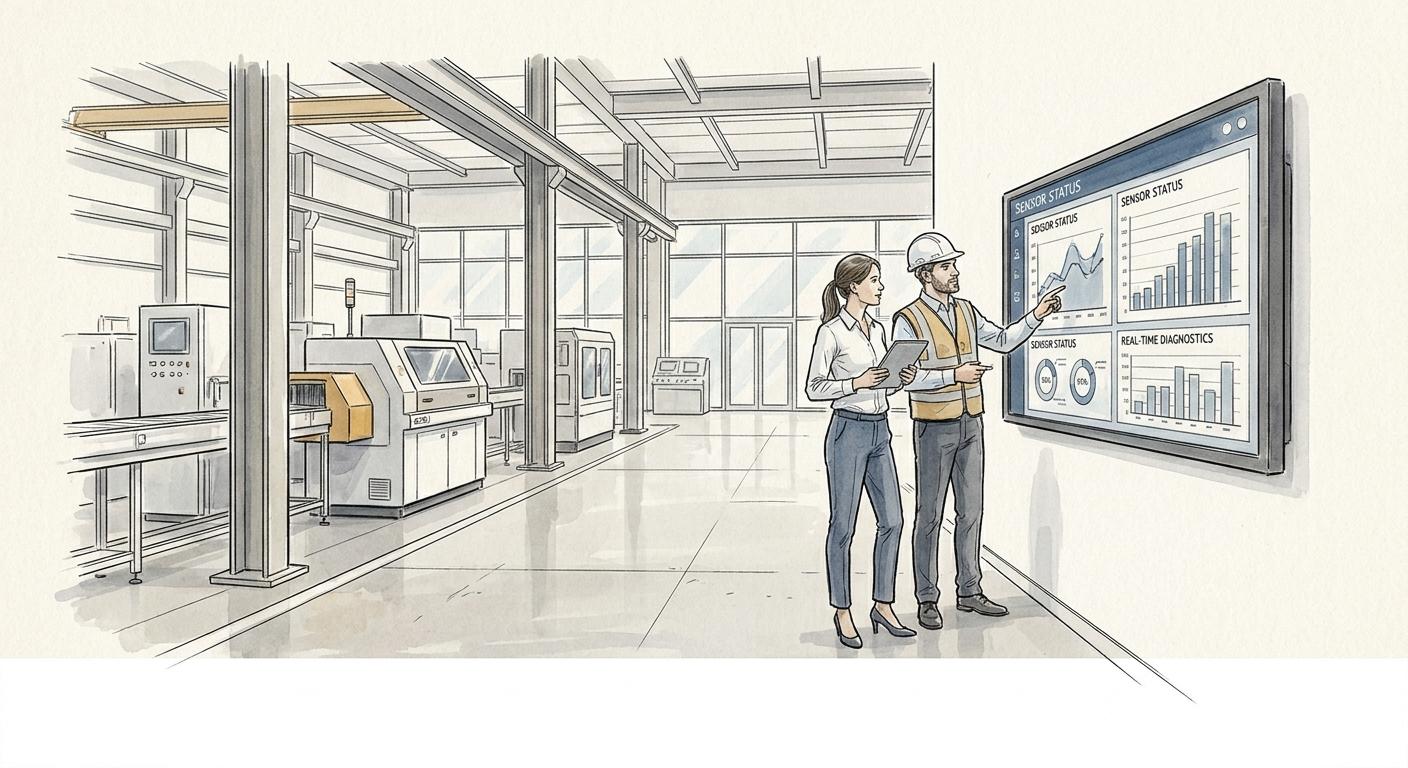
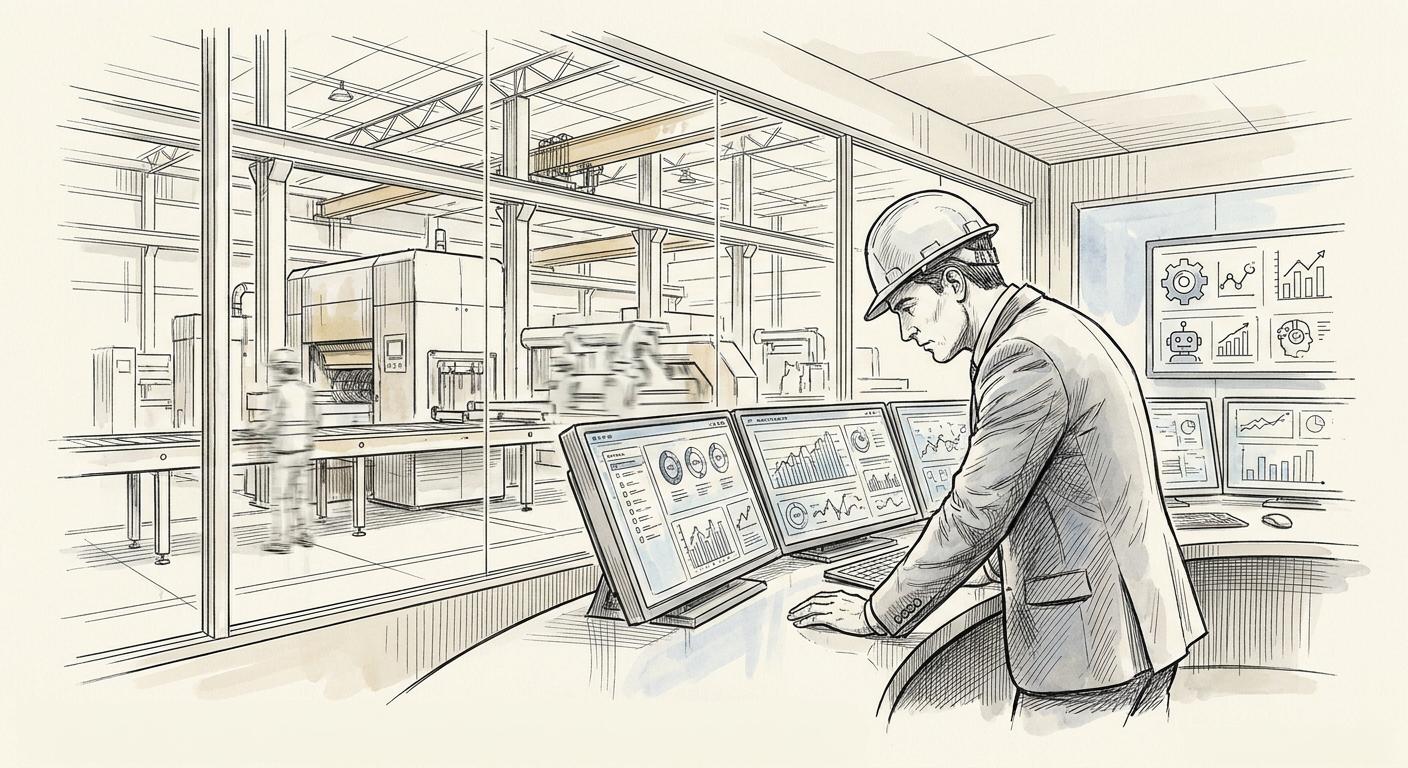
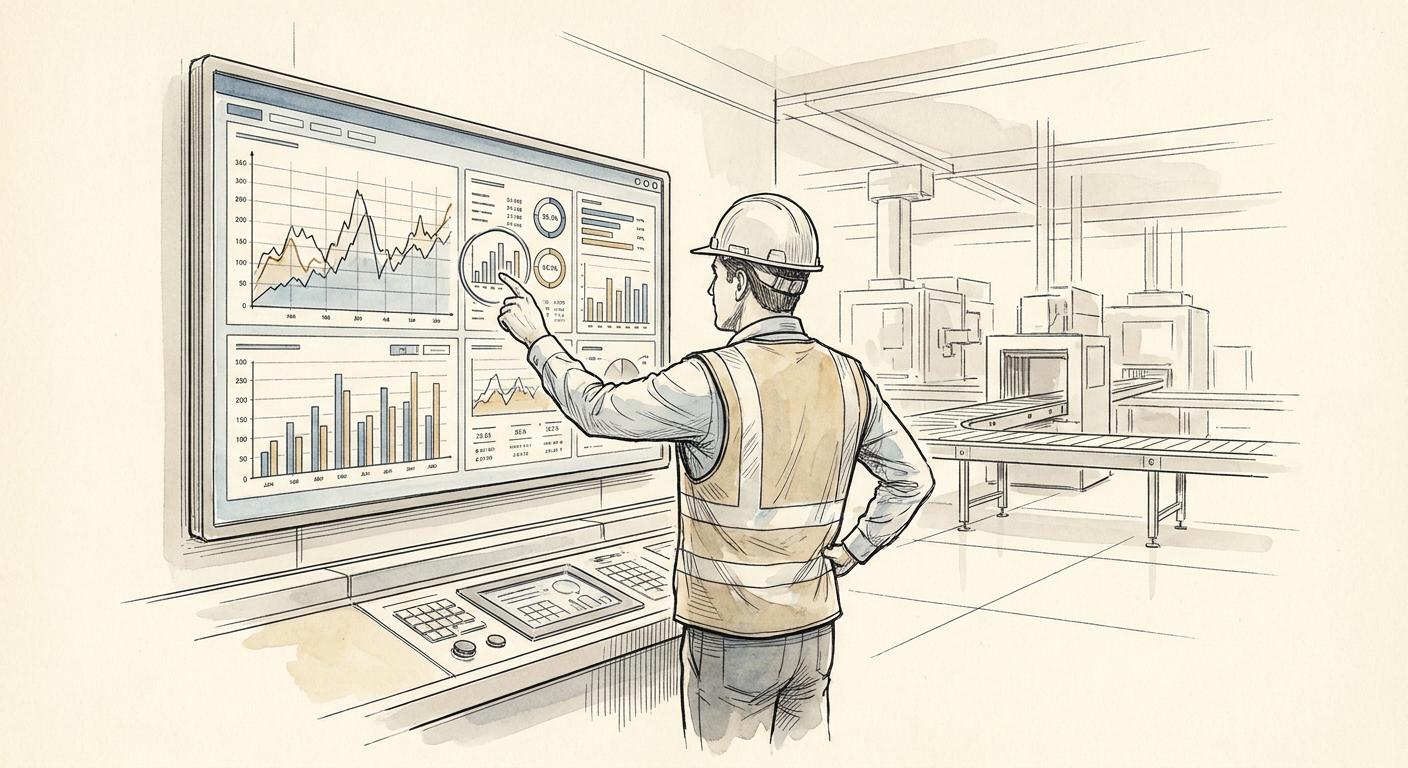
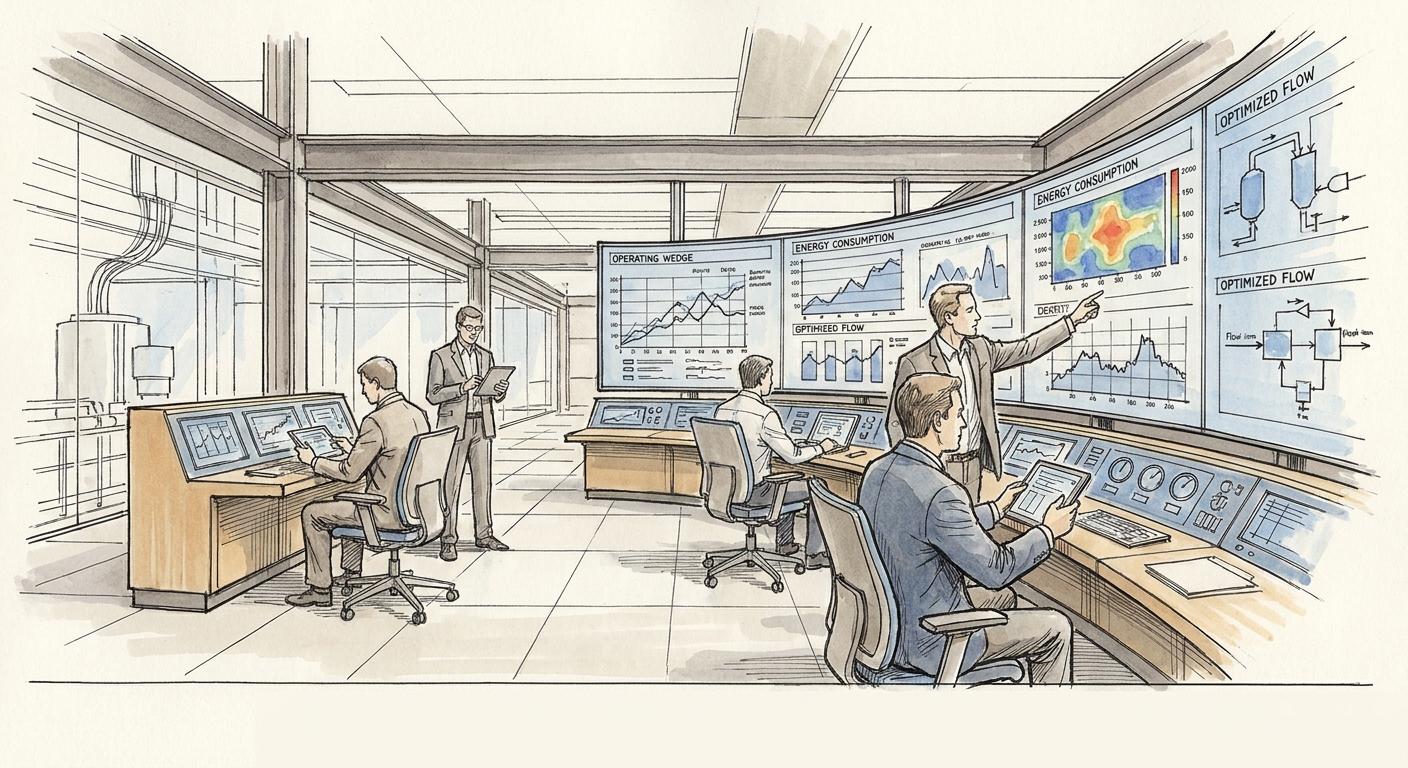
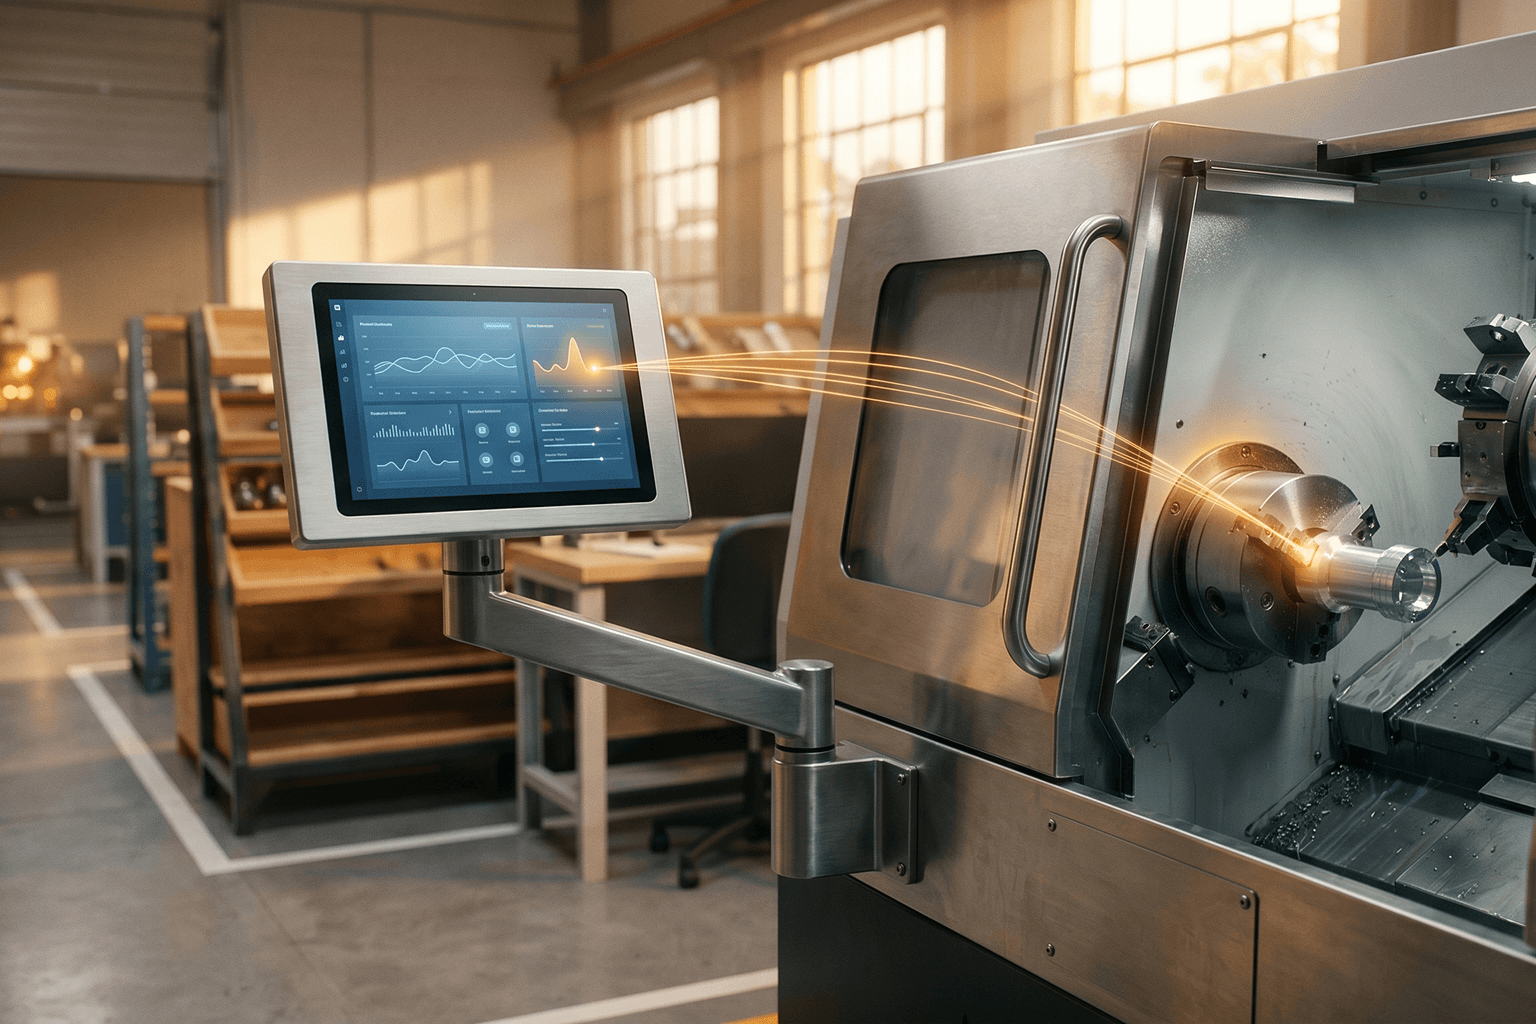
Moving to automated workforce analytics means deploying systems that flag variances while the shift is still running. Modern integration layers pull real-time data from machine PLCs, badge swipes, and ERP work orders into a single dashboard.
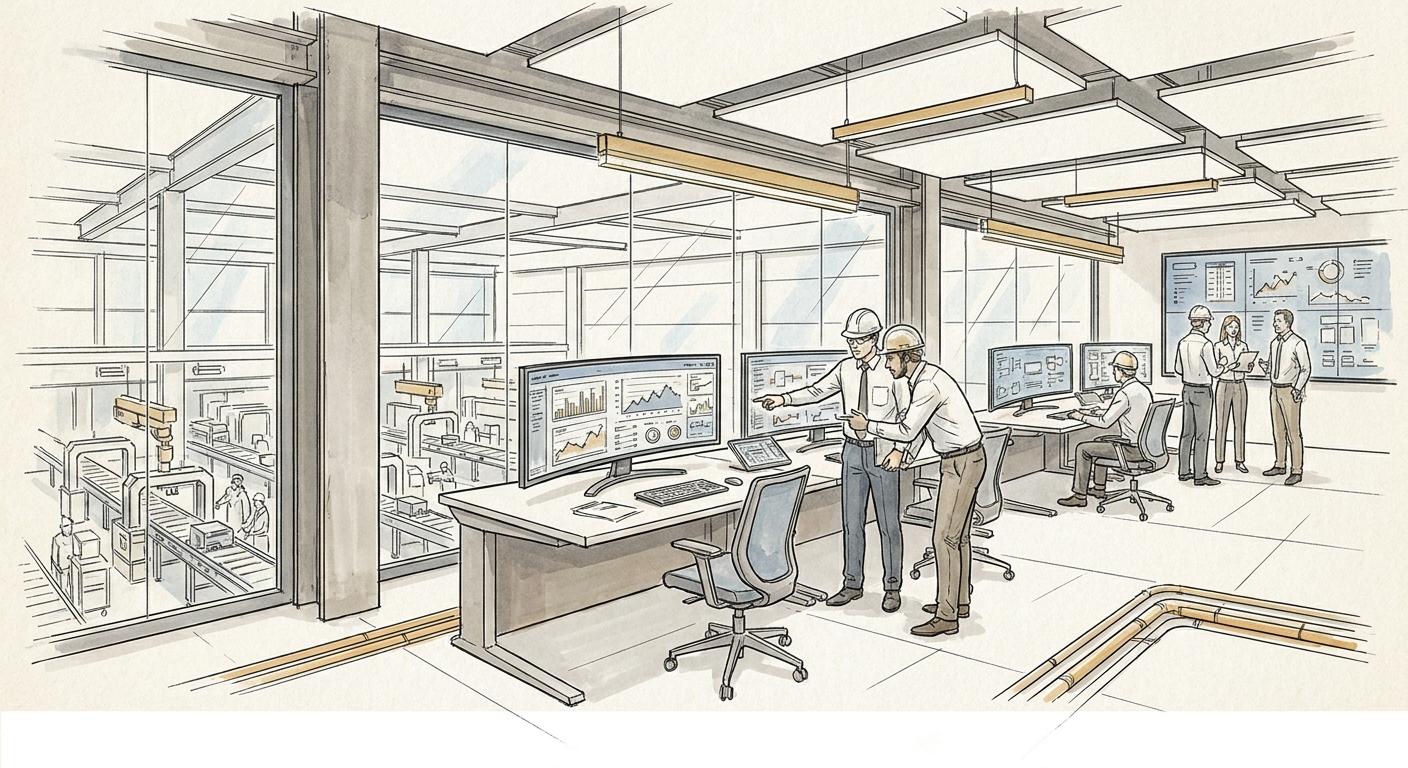
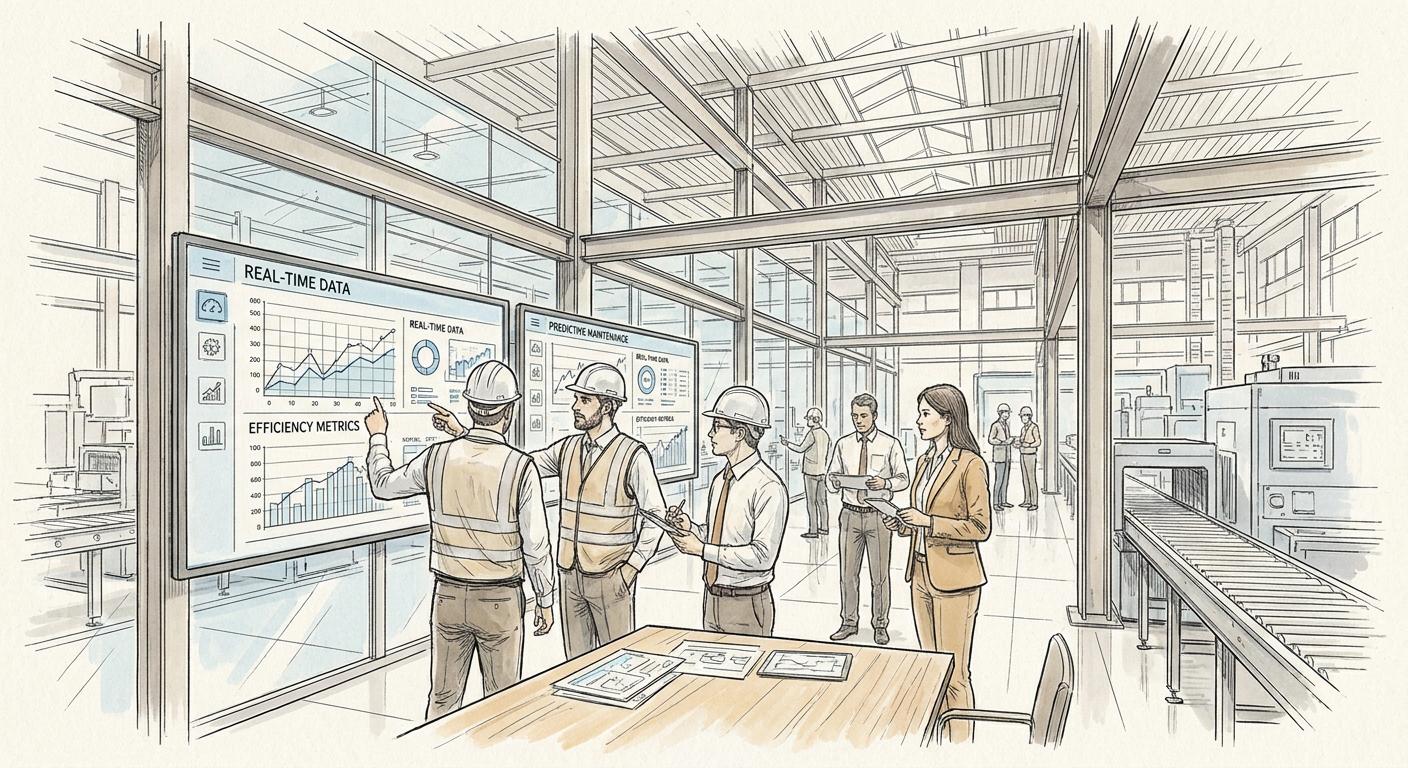
When a specific line deviates from standard labor allocation by more than 10 percent, the system alerts the shift supervisor immediately rather than waiting for the weekly review meeting. This real-time feedback loop allows operators to adjust pacing, reallocate floating labor, or call maintenance before minor issues become major OTIF misses.
Organizations using structured operational analytics routinely see significant reductions in manual data collection effort, freeing plant engineers to focus on root-cause problem solving rather than administrative reporting.
From Audit to Execution: Fixing Variance in 60-90 Days
Auditing shift variance should not require a multi-year digital transformation or a disruptive ERP overhaul. Plant operators and PE operating partners need rapid time-to-value to protect operating leverage and improve EBITDA within the investment window.
We enter through targeted operational diagnostics and deploy practical workforce analytics that plug directly into your existing infrastructure. By focusing on high-impact use cases like automated shift variance tracking, plants achieve measurable results in 60-90 days without overwhelming the plant floor.
Upskilling shop floor supervisors to interpret real-time workforce data turns standard software tools into actual operational ROI. The goal is a repeatable playbook that stabilizes margins, eliminates estimate-vs-actual gaps, and prepares the asset for a successful exit.
Frequently Asked Questions
What causes the biggest gaps in shift variance?
The largest gaps stem from the disconnect between planned routing times in the ERP and actual shop floor execution, compounded by manual time-coding errors and unrecorded micro-stoppages. When operators manually log downtime at the end of a shift, speed losses and waiting times are routinely underreported.
How do automated workforce analytics differ from traditional OEE tracking?
Traditional OEE tracks machine states and availability, whereas automated workforce analytics tie labor allocation, operator skill sets, and production output together in real-time. This provides plant managers with a complete view of both machine performance and direct labor utilization.
How fast can a manufacturing plant deploy automated shift variance tracking?
Plants can achieve their first measurable operational results and deploy automated shift variance use cases in 60 to 90 days. This approach avoids heavy software overhauls by integrating data streams directly into existing infrastructure.
Book a Manufacturing Diagnostic at ifor.ai/solutions/manufacturing

Ofer Hermoni, Ph.D.
Founder & Chief AI Officer at iForAI